
Wishing you a Fluorescent New Year!
Thank you for being a part of our 2025!
We hope you had a wonderful and restful holiday season, filled with new memories, a slower pace, and quality time with family and friends.
We look forward to an exciting 2026!
Working with FFT data in the iris workspace
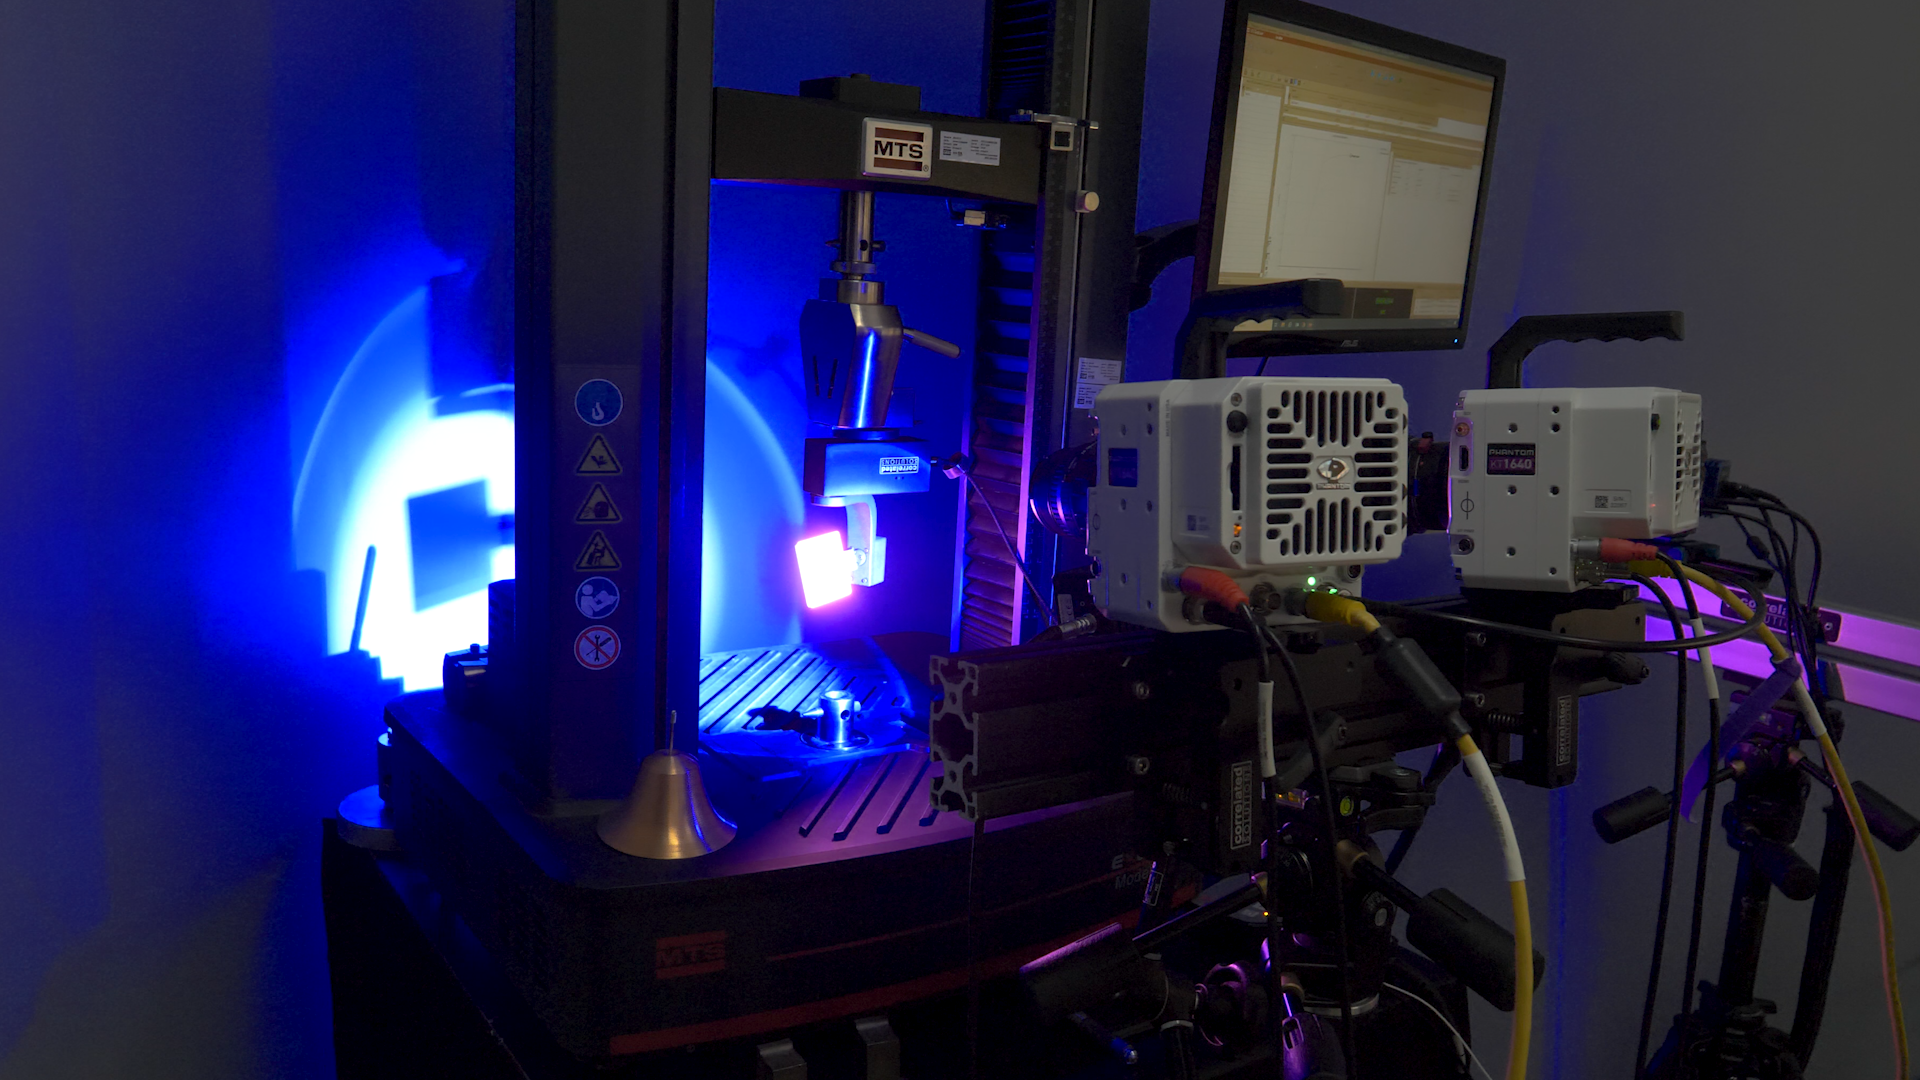
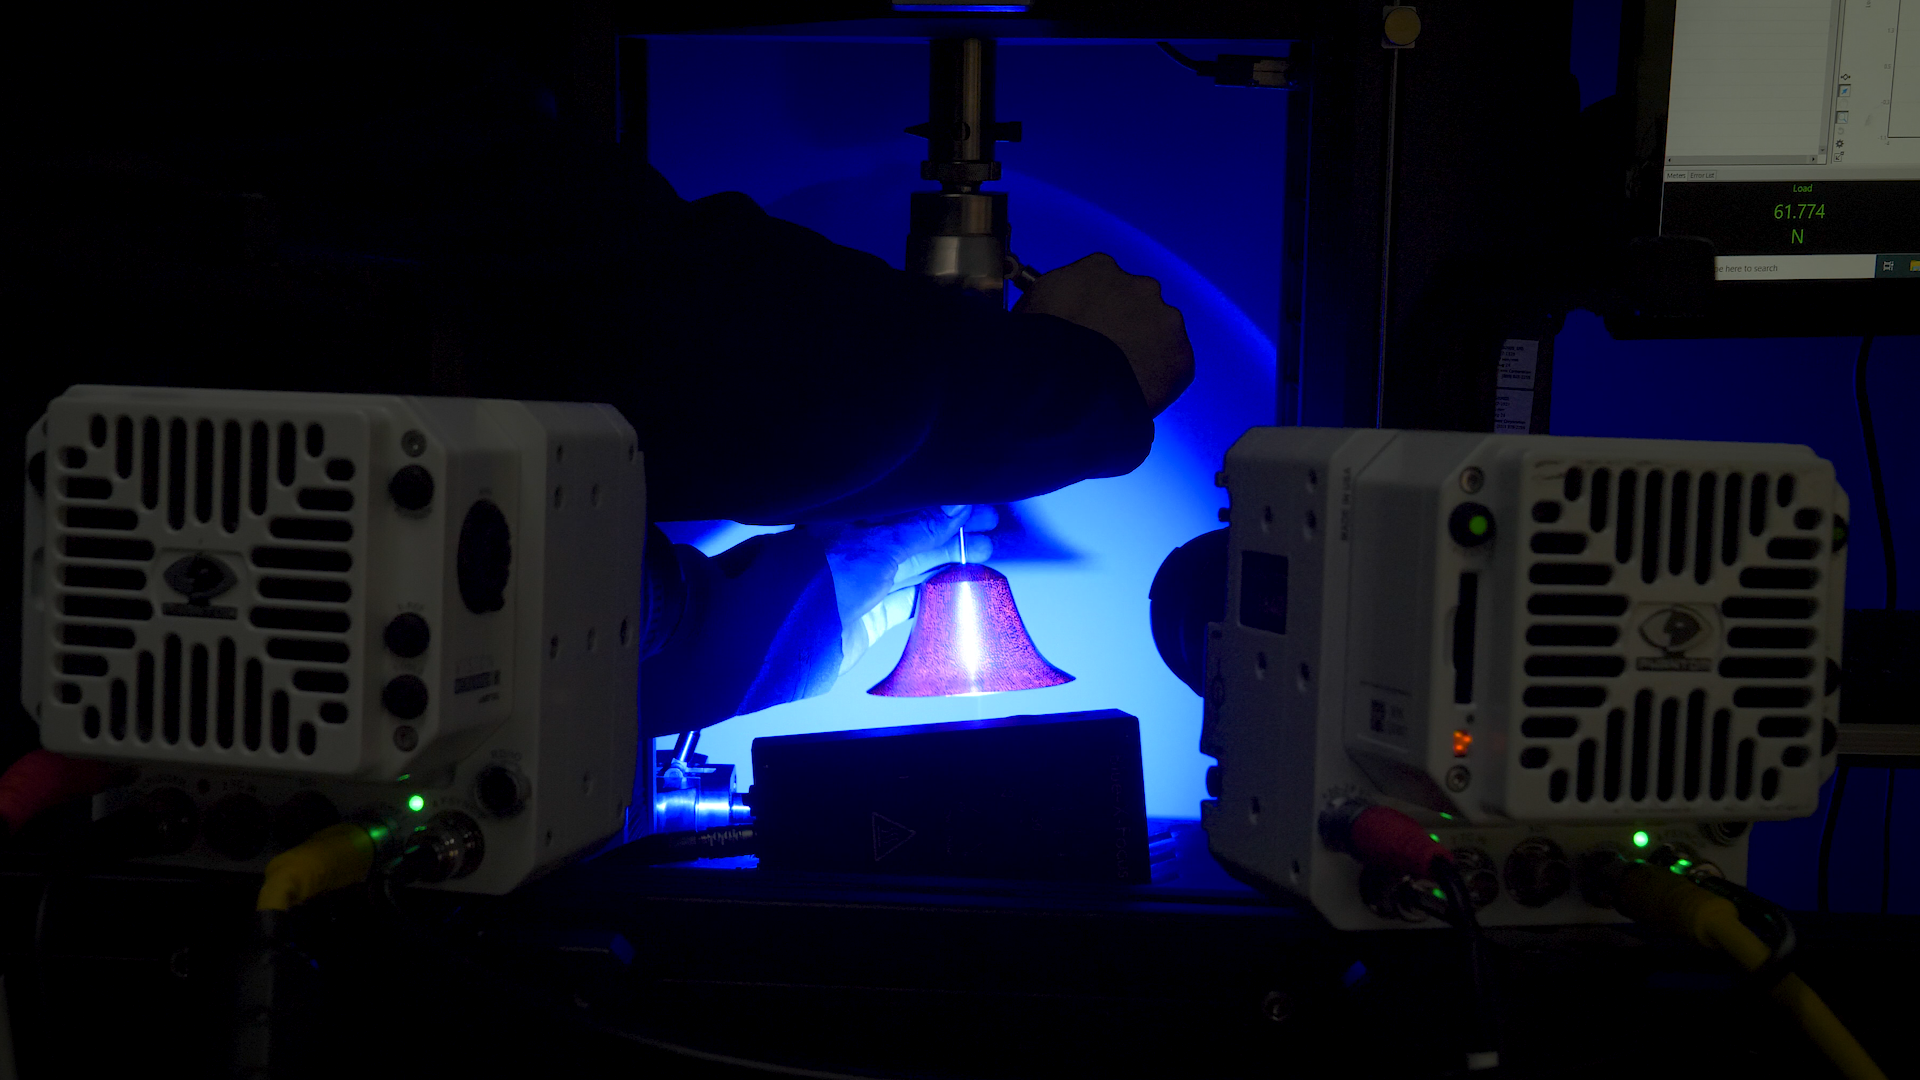
To celebrate the New Year, engineers at Correlated Solutions conducted a simple test using the FFT analysis workspace in VIC-3D 11 to find the operational deflection shapes (ODS) which occur after excitation of a holiday bell. This is just the latest example of how DIC from Correlated Solutions is redefining vibration measurement with full-field, non-contact, single excitation analysis.
The short, 4K video shown above was exported directly from the iris visualization workspace in VIC-3D 11.
Here are some further test specifications:
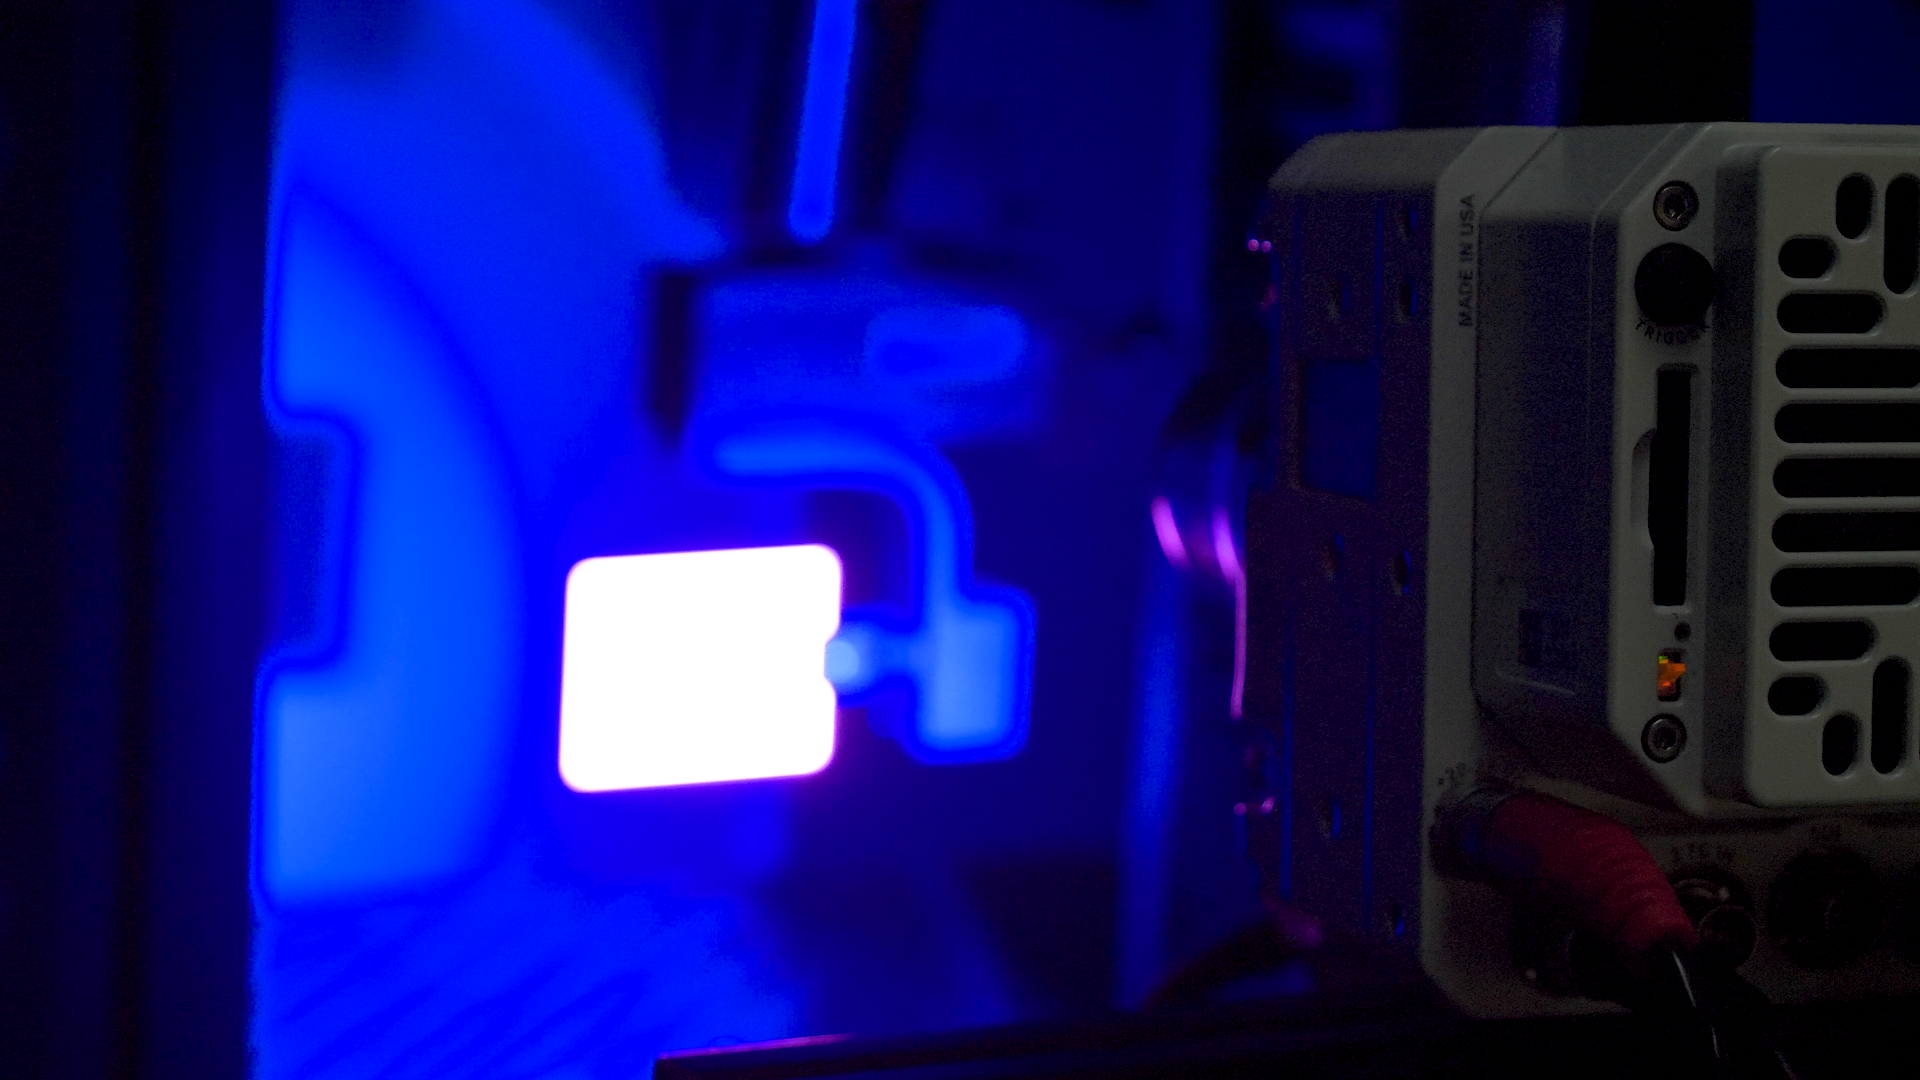
Cameras: Phantom High-Speed KT 1640
Lens: 90 mm f/3.5
FOV: 150 mm x 150 mm
Image Scale: 15.5 mm
Stereo angle: 23 degrees
Standoff Distance: approx. 500 mm
Acquisition rate: 3760 fps
Resolution: 2560 px x 1664 px
Approx. Feature Size: 10-15 pixels (edited)
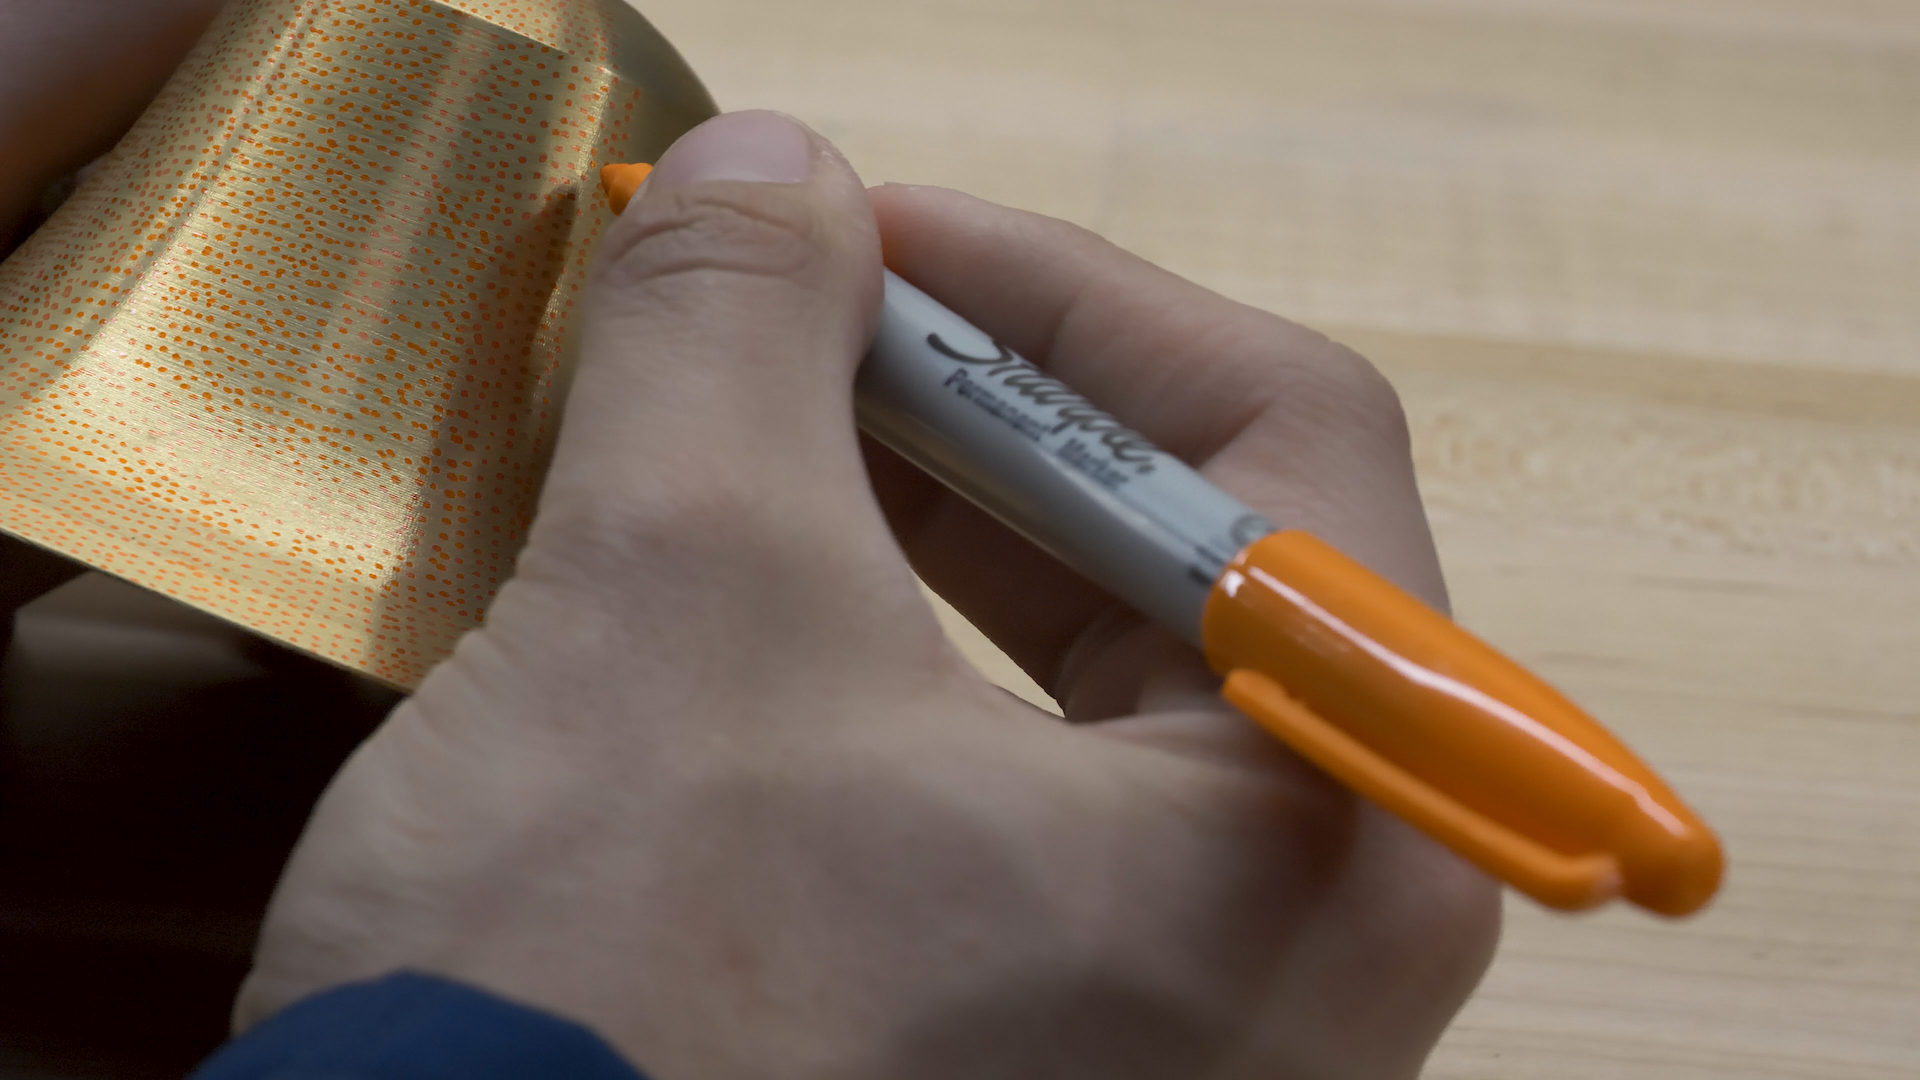
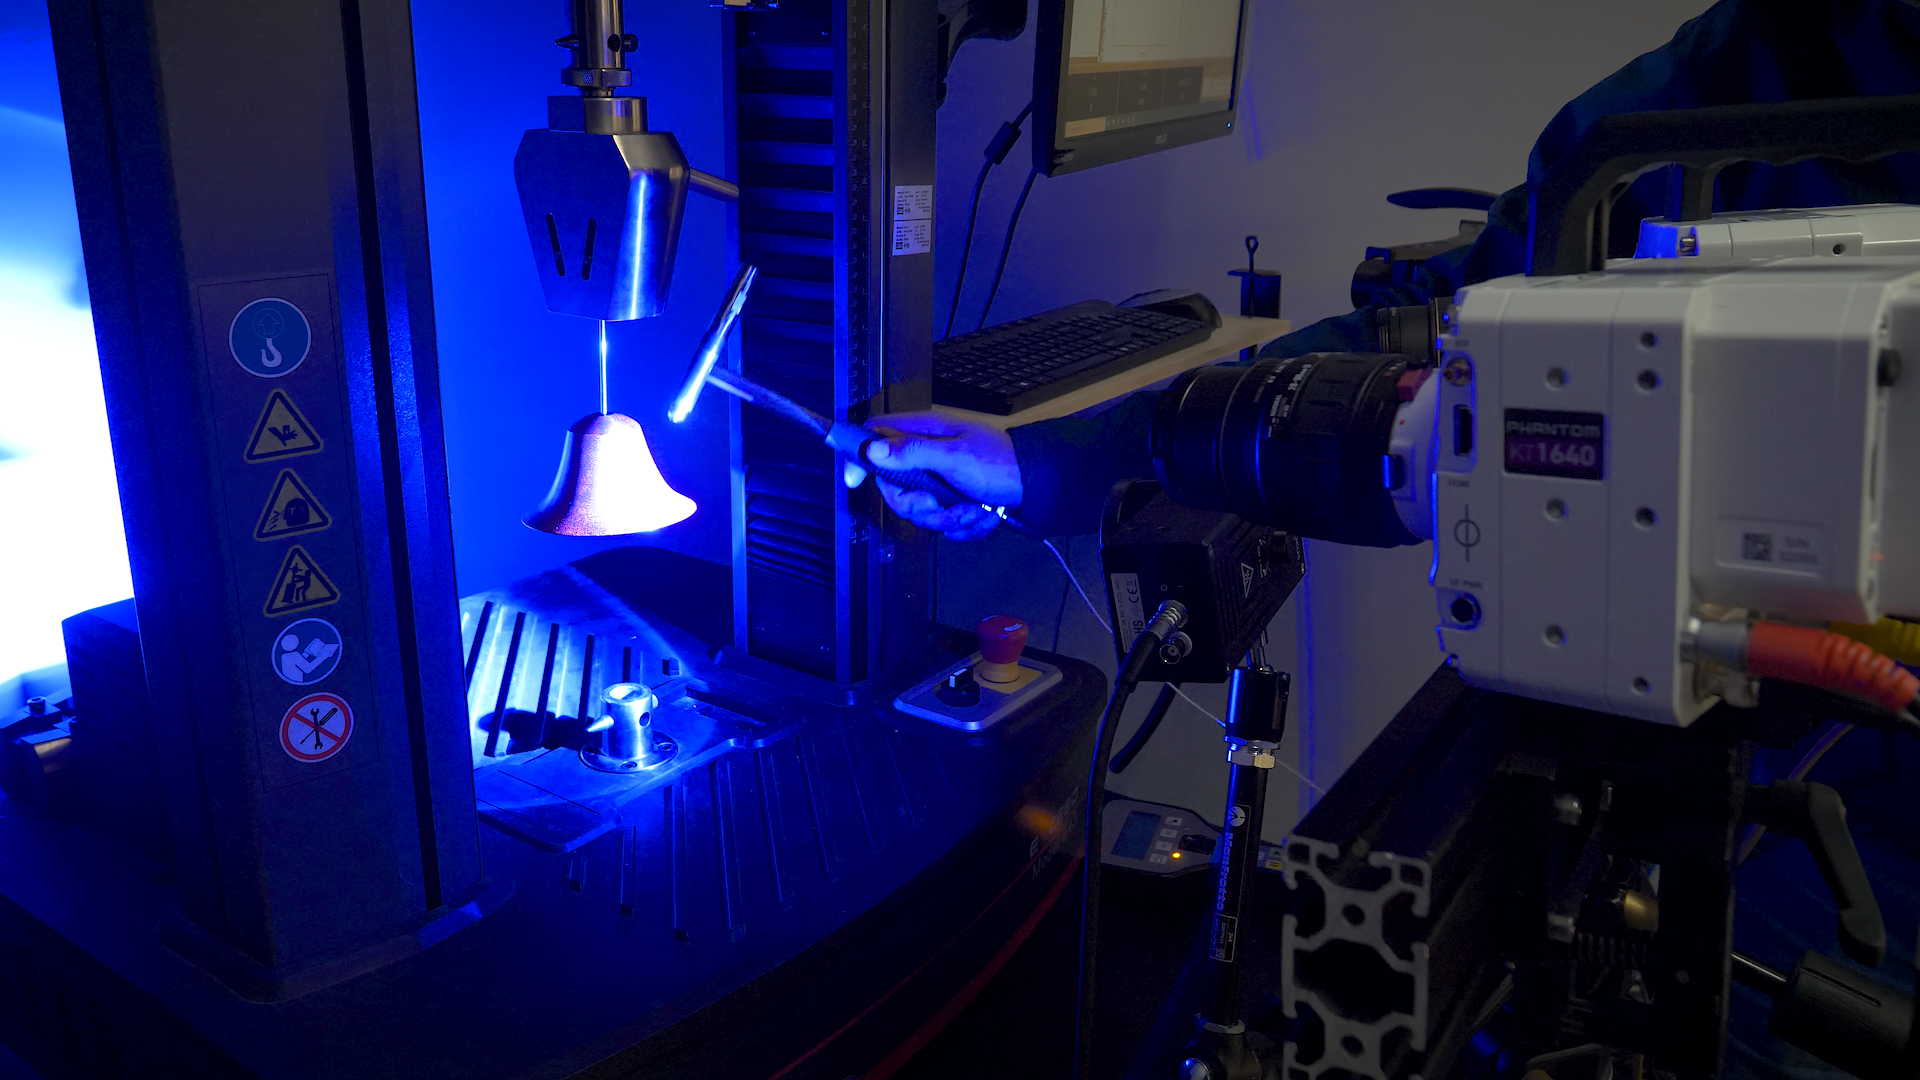
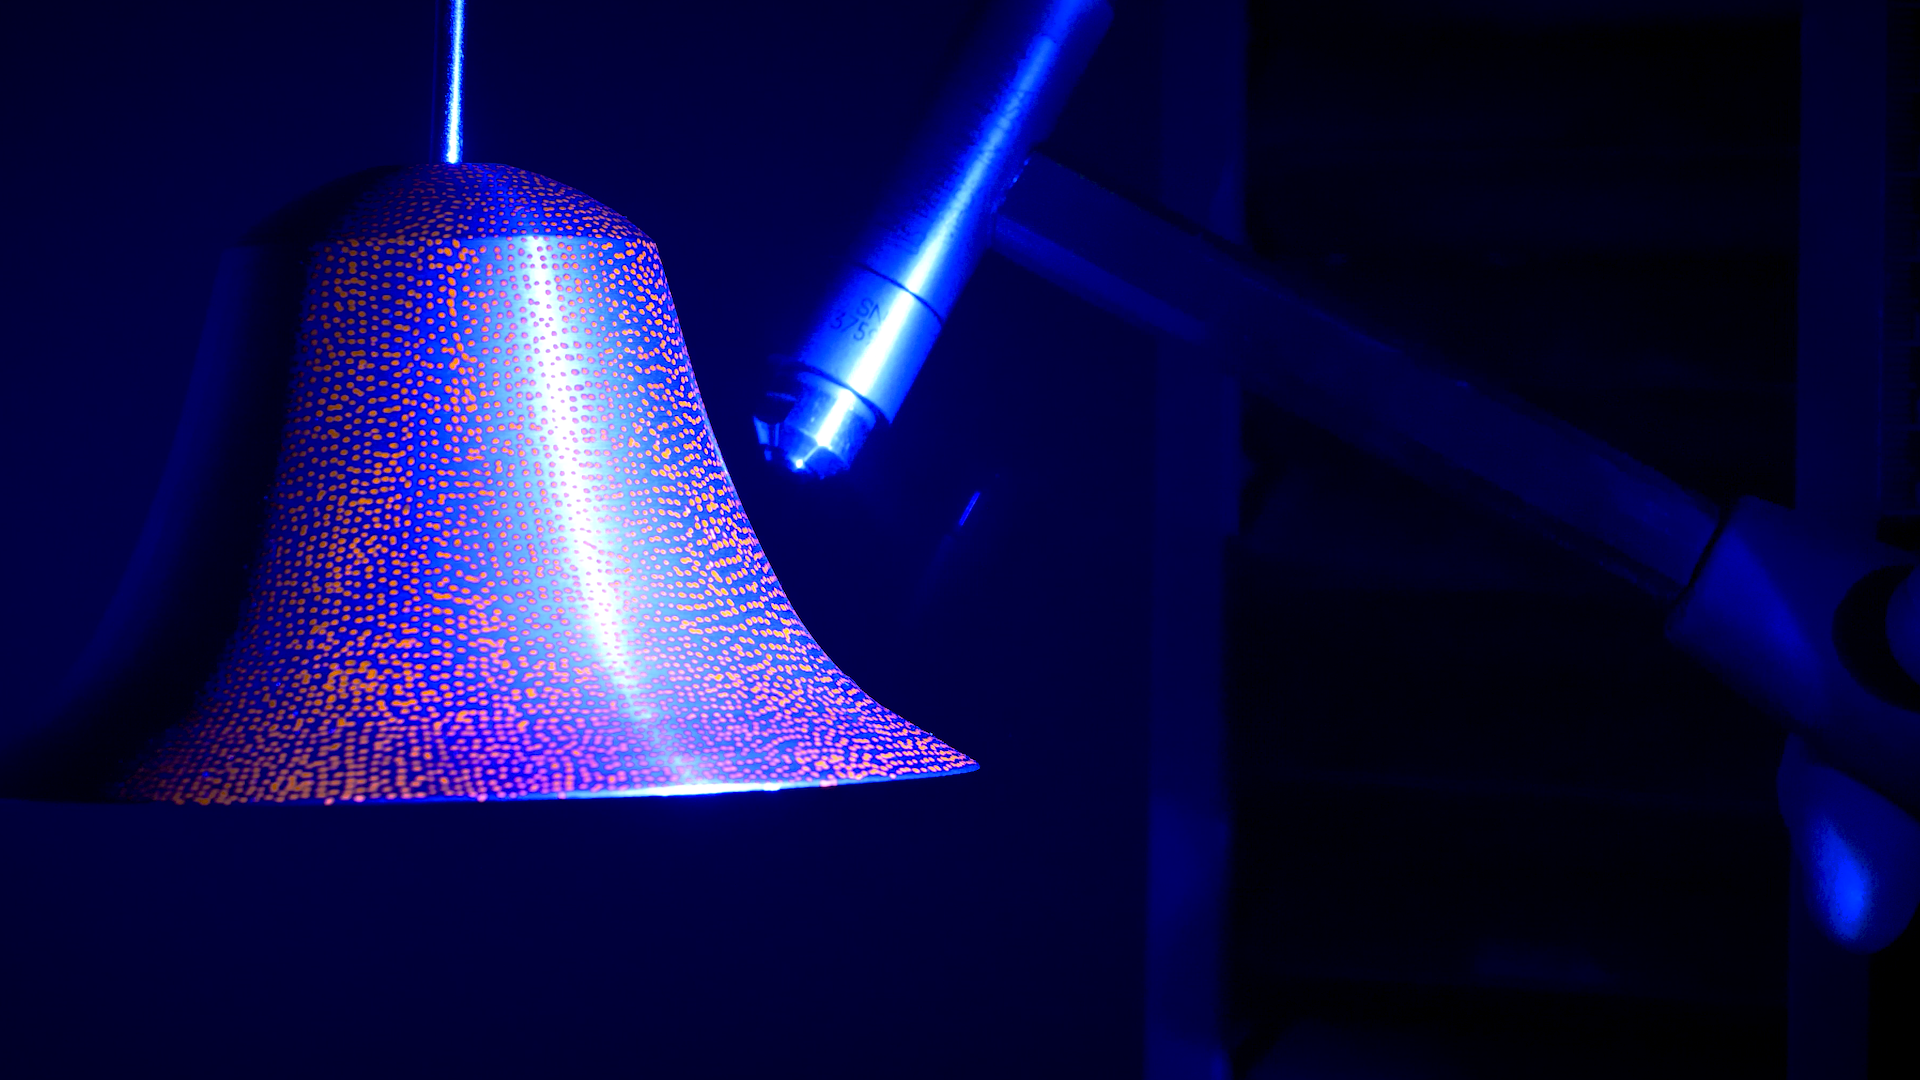
To work around the challenges that a shiny object presents, we opted for fluorescent speckles - applied with a sharpie - to avoid the need for a white basecoat.
(Stay tuned in 2026 as we roll out more examples of DIC on shiny samples to feature the development of our Fluorescent Speckling program!)
The cameras were quickly and accurately calibrated using the VIC-Gimbal and VIC-Snap image acquisition software. After the analysis in the updated FFT workspace within VIC-3D 11, the data was moved to the iris data visualization workspace to create this video. The next tutorial in our Visualizing DIC series will cover how to get FFT data into the iris workspace to produce this overlay effect on an external image sequence.
As always, if you have any questions about how the advanced optical measurement systems from Correlated Solutions can impact your research, please contact one of our Sales engineers today!