

Announcing
VIC-3D 10
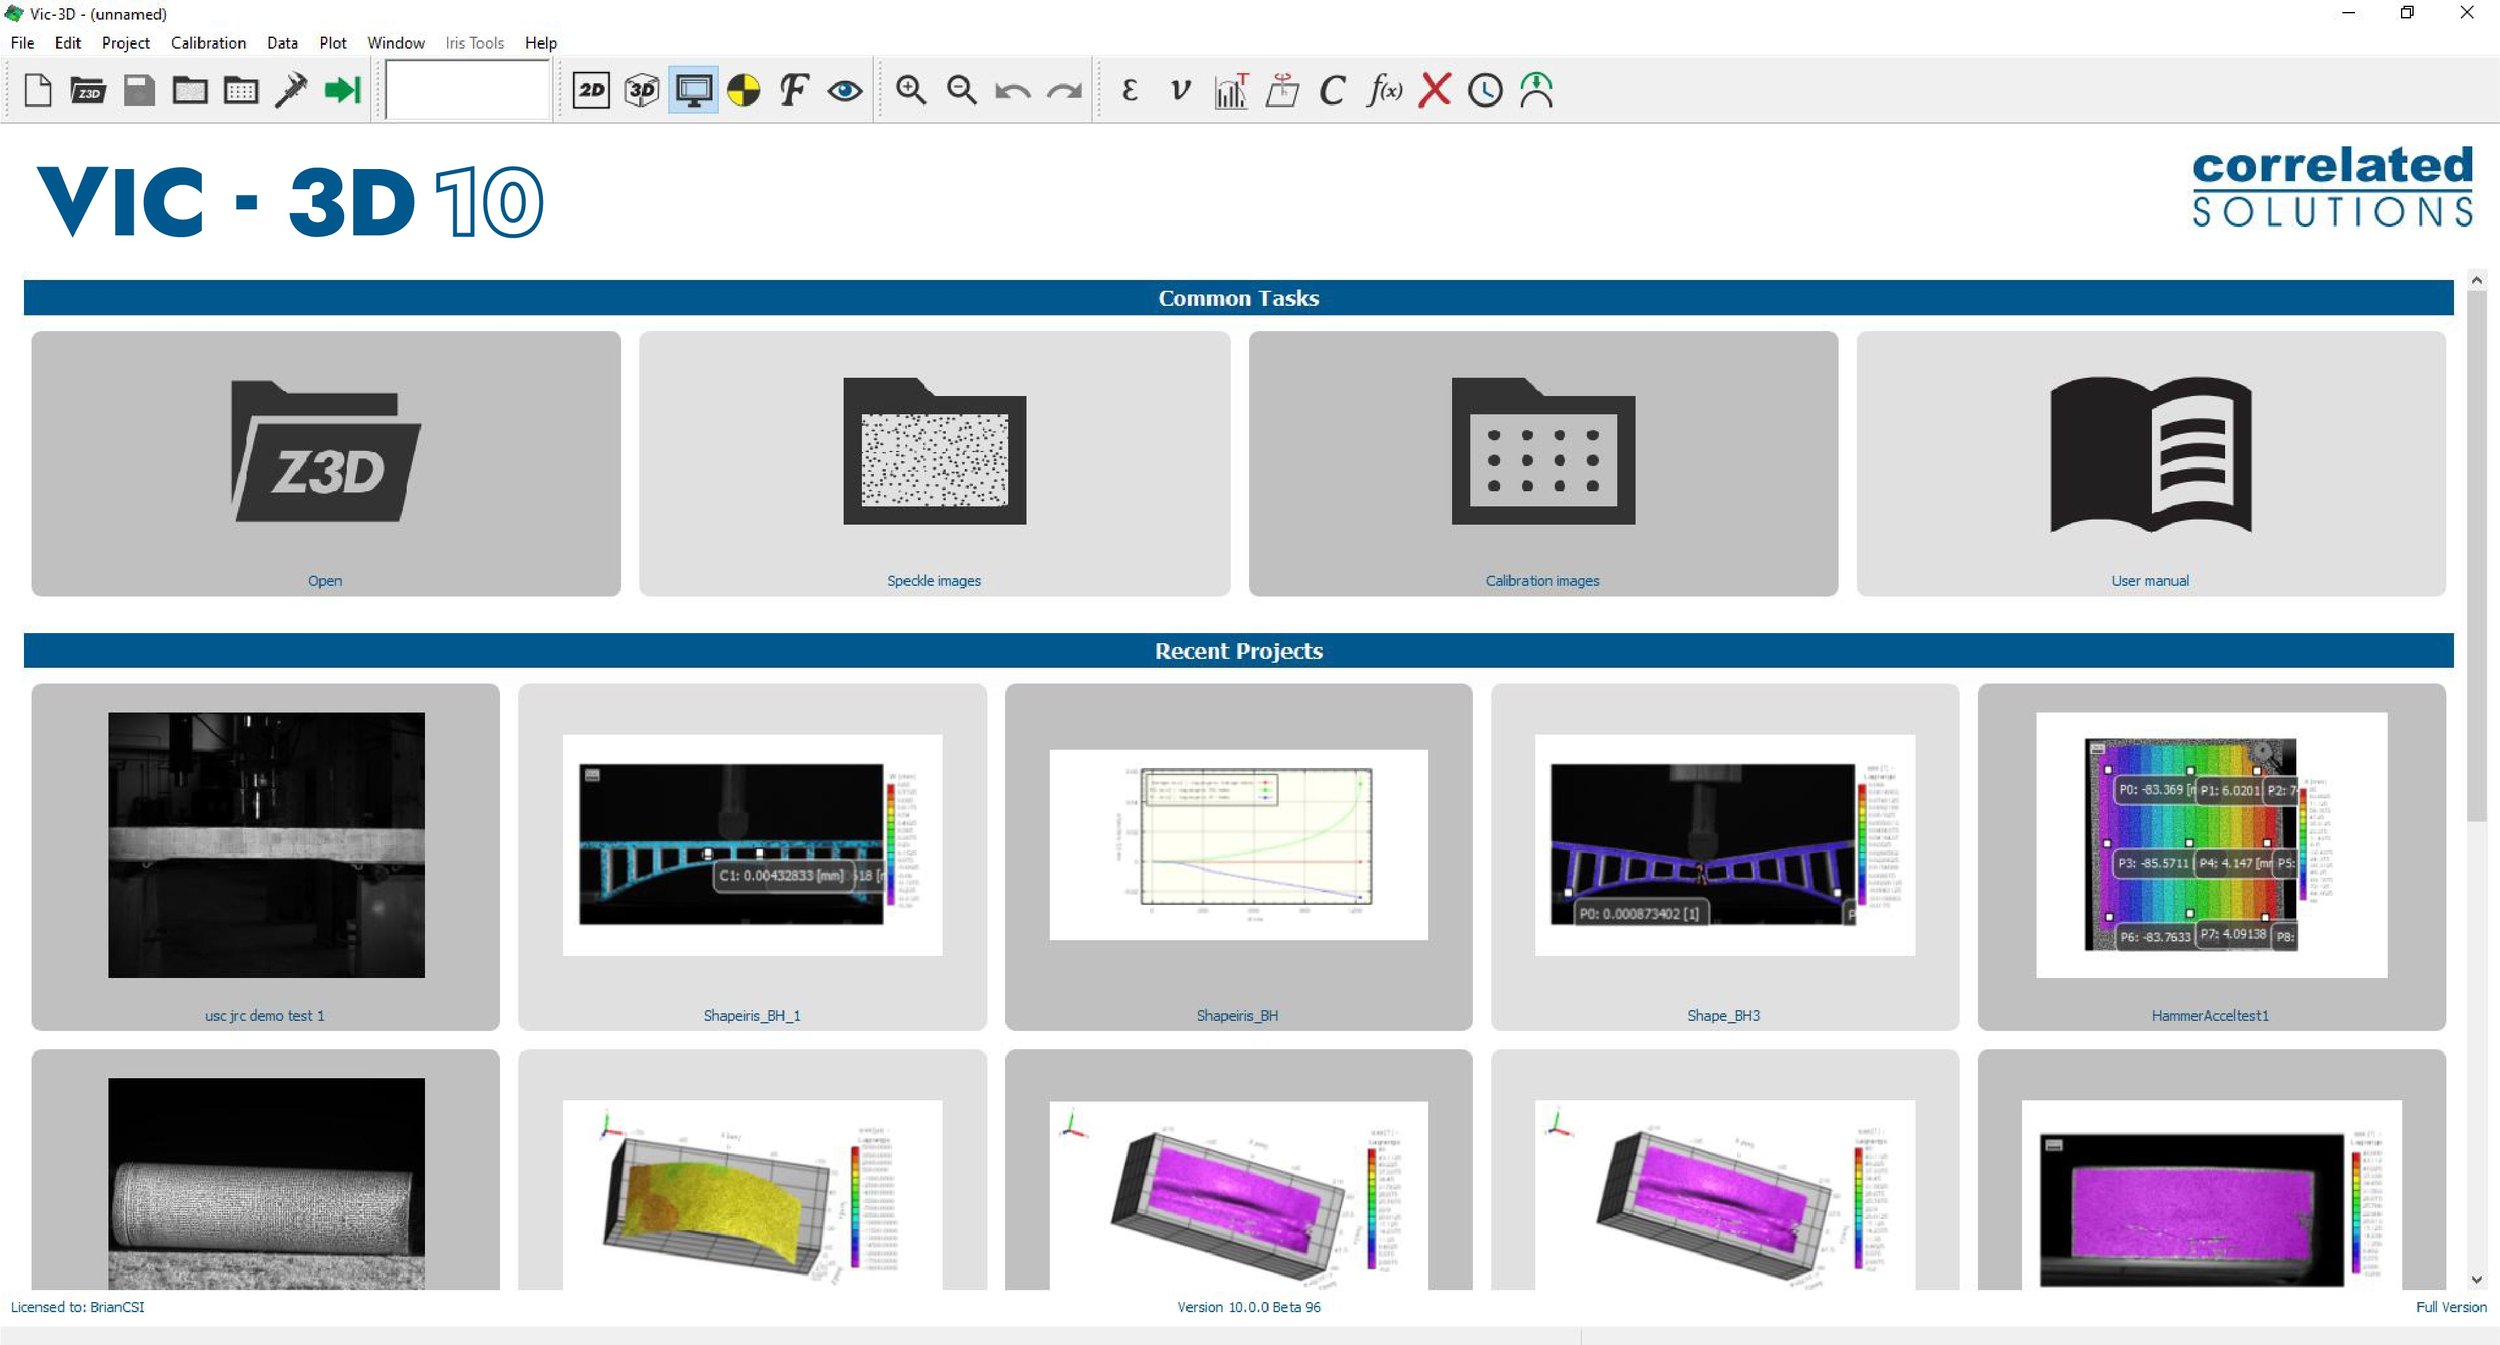
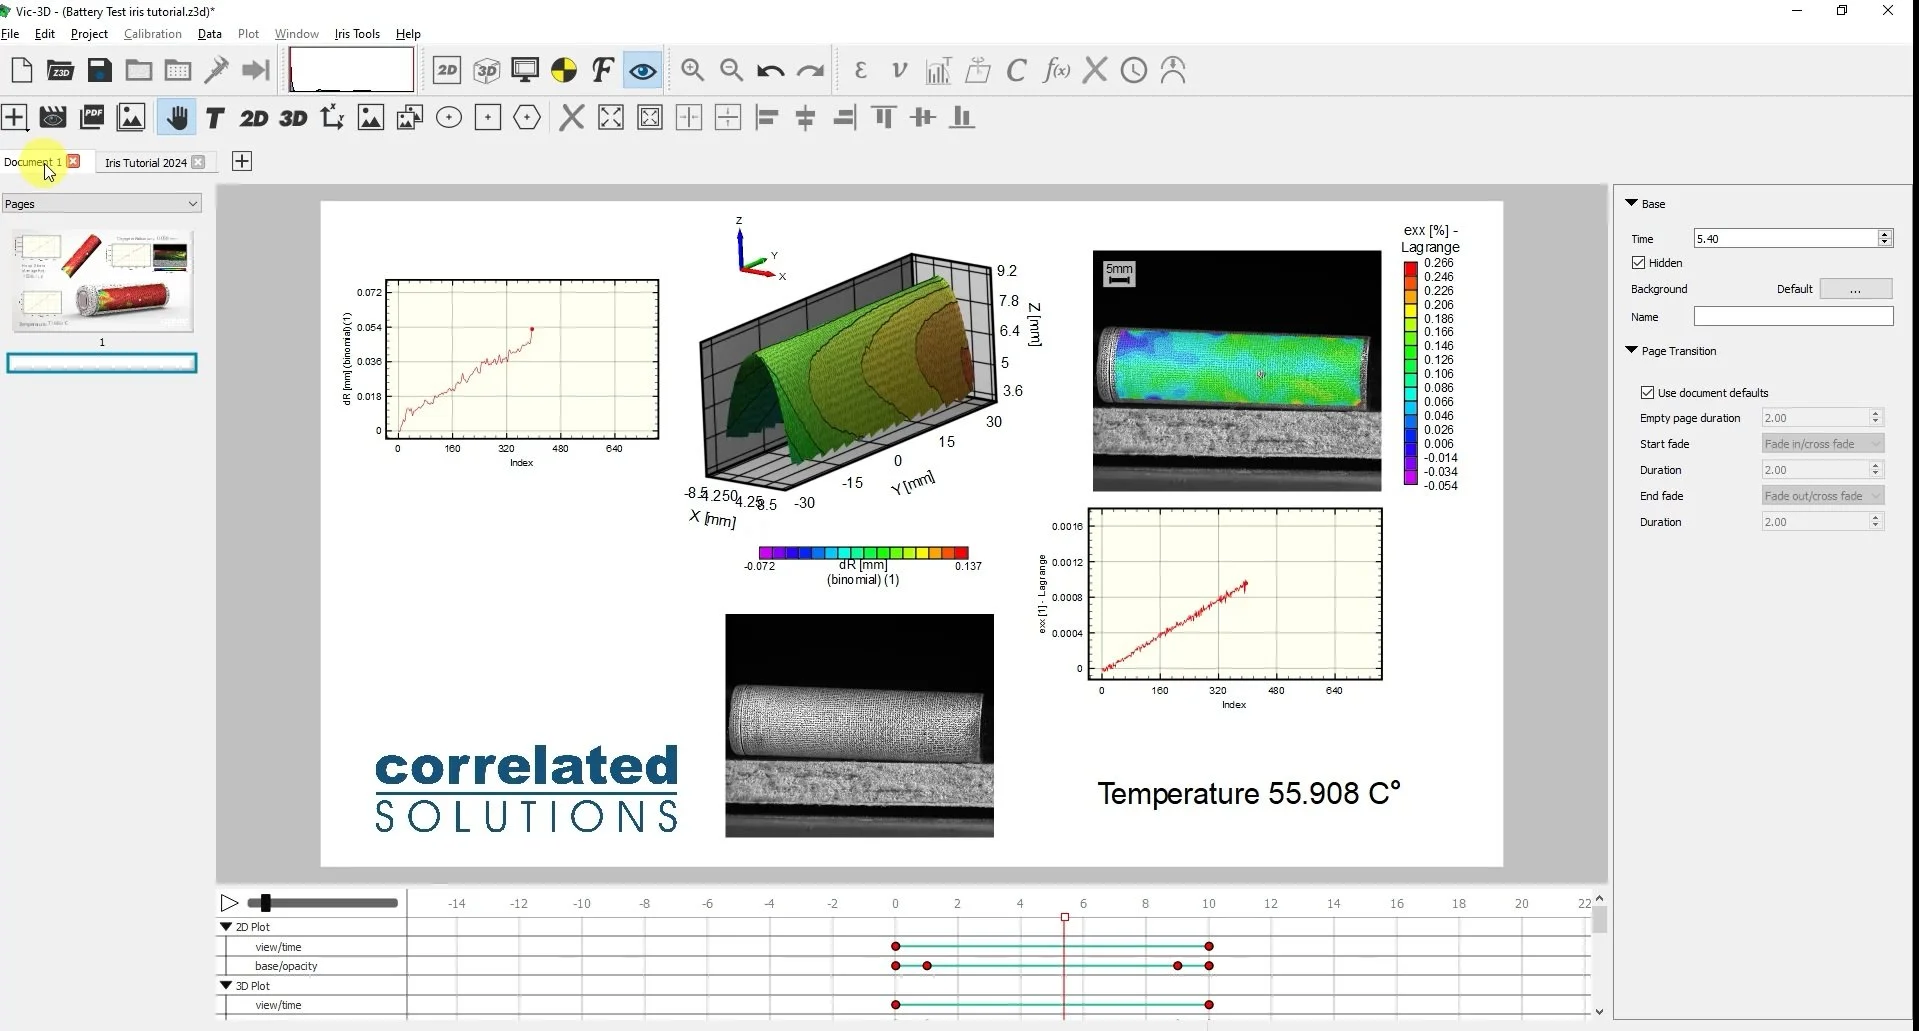
Correlated Solutions is proud to announce the release of VIC-3D 10, an unparalleled DIC workspace with features designed specifically to facilitate 3D data analysis and visualization. Building on iris, the data visualization engine introduced in Version 9, the all-new VIC-3D 10 delivers a range of new capabilities that broaden DIC’s scope for FFT projects, FEA validation, and integrated stress analysis. In addition, the iris workspace has been significantly updated to provide even more flexibility and functionality to display your DIC analysis clearly and professionally. Contact our Sales Team today to discuss your application and to learn more about a limited-time update offer.
Taking Digital Image Correlation to the Next Level


What’s New in VIC-3D 10
-

Integrated stress analyzer converts strain history to stress with models defined through a dialog or through JSON files.
-

New VSG analysis tool automates & streamlines the determination of optimal VSG size in accordance with the DIC Good Practices Guide.
-

New frequency response function measurements integrate force input data with a powerful FFT module for complete response analysis.
-

New FFT vibration visualization in iris allows for in-plane & out-of-plane ODS to be displayed in stunning, high-resolution graphics.
-

In conjunction with FE simulations in Abaqus & Ansys, users can now more effectively and efficiently validate FEA results.
-

Import extractions, image & data sequences from other projects for direct comparison and improved visualization Improved visualization of extracted data on 2D and 3D plots.
DIC workspace improvements, iris updates & more, now in VIC-3D 10
Import extractions, image & data sequences from other projects for direct comparison and improved visualization
Improved visualization of extracted data on 2D and 3D plots
Multiple iris documents in a single project
Customizable color maps for contour plots
Improved data probing in 2D and 3D plots
Improved data extraction facilities
Improved unit management for all variables
New global preferences dialog for report documents, 2D & 3D plots, graphs, and more
FFT data may be exported in Universal File Format (UNV)
Support for the newest 64+ core processors enabling analysis at over 1,000,000 points per second
Updated Python module to support latest Python versions
Updated VIC-Snap Remote App for Android platform
We invite you to contact our Sales Team for details on the powerful new VIC-3D 10 software, a range of new hardware, and a special, limited time upgrade offer!
