Evaluating the Radial Force Profile of a Stent

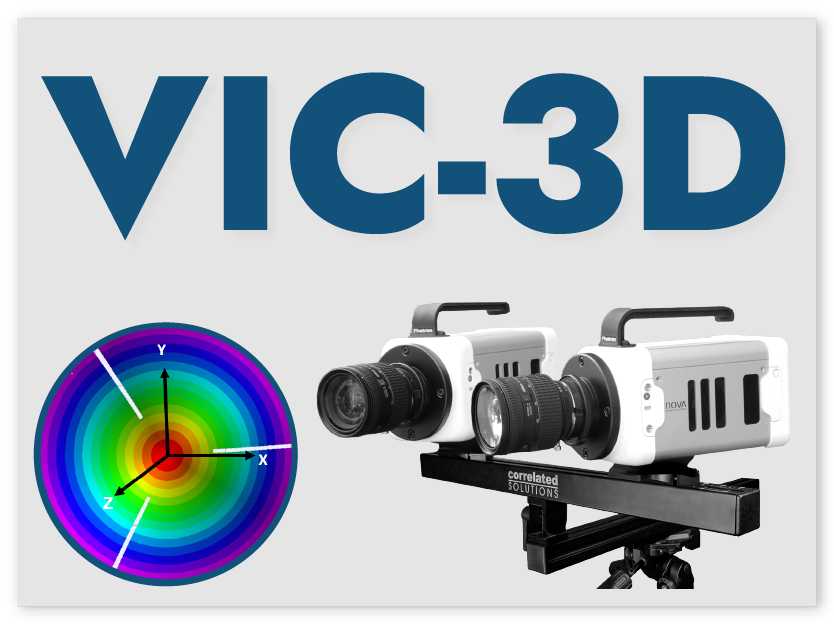
Figure 1. Experimental setup using the VIC-3D system
Medical device manufacturers have the responsibility to create and maintain efficient and safe products to keep the world population healthy. Dr. Kenneth Perry of EchoBio LLC is an industry leader and expert on the experimental validation of implantable medical devices. Recently, Dr. Perry was tasked with evaluating the radial force profile of a braided, self-expanding stent for use in correcting blocked blood vessels. Dr. Perry specifically needed to examine how the radial force changed from the end of the stent to the middle of the stent. This quantitative data is critical to the proper design and function of the stent, and Digital Image Correlation was the only technology commercially available that could provide the measurements needed at the required accuracy. Dr. Perry utilized the VIC-3D system to make such measurements with a valiant success that could potentially revolutionize the medical device industry.
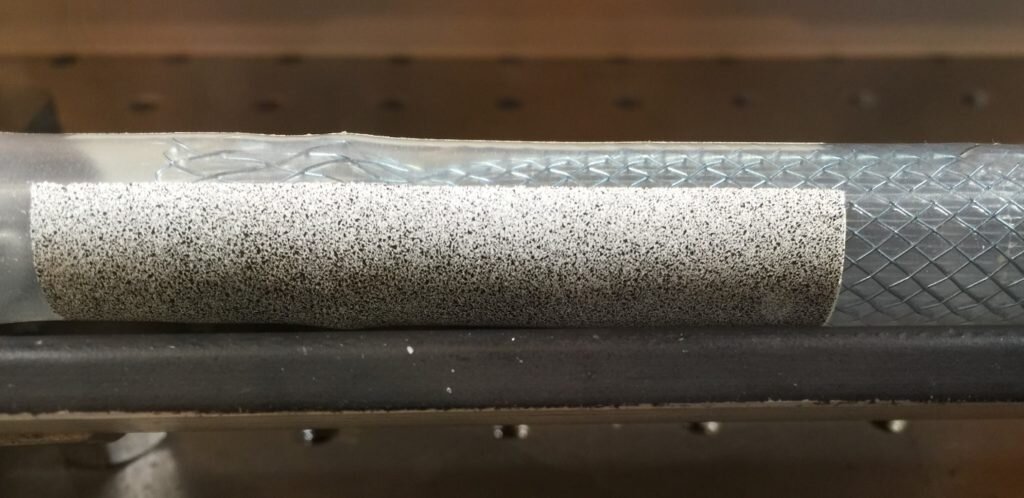
Figure 2. Speckled silicone tube with stent inserted.
Dr. Perry began his experiments using perfectly straight silicone tubes that were custom-made to have mechanical properties similar to a blood vessel. His experimental setup is shown above in Figure 1. The experiment involved deploying the stents into the tubes and measuring the resulting deformation. Dr. Perry knew that any simplified point or line measurement on his samples would have been misleading. This is where the VIC-3D system enters the experiment and provided Dr. Perry with the full field data he needed to be confident in his measurements and publish accurate results for his client.
The silicone tube was prepared for the experiment by having a speckle pattern applied using off-the-shelf spray paint. The area of interest was masked off and a white base coat was applied. The black speckles were then simply added by using an over-spray technique with black spray paint. Figure 2 above shows the speckled silicone tube with the stent inserted.

Figure 3. Change in radius contour under load from expanded stent.
The change in radius variable and resulting contour plot was the most valuable data for Dr. Perry because it clearly shows the largest force is located near the end of the stent. This contour plot, shown above in Figure 3, also indicates areas of larger radial force that could have gone unnoticed using traditional measurement techniques.

Figure 4. 3D change in radius contour plot showing displacement vectors.
Not only did Dr. Perry obtain full-field displacement data, but he was also able to easily quantify the radial force profile of the stent and show the circumferential variation that resulted from the underlying woven stent structure. Figure 4 above shows the displacement vectors of the stent in a full-field 3D contour plot. The displacement vectors show the magnitude of the resulting deformation which allows Dr. Perry to easily interpret the data as well as publish professional results for his client. The VIC-3D system gave Dr. Perry the ability to measure with confidence.
“VIC-3D was an amazing tool. Any simplified line or point-wise measurement would have been misleading. VIC-3D gave us full-field data we needed to be confident with the measurements.” -Dr. Kenneth Perry, ECHOBIO LLC
“We needed robust calibration, documentation, and high-fidelity measurements so we designed our experiment accordingly using the VIC-3D system.”